

India went from 90,000 UPI transactions in August 2016 to 24.51 billion in August 2026. That jump shows how quickly digital payments have moved from an option to an everyday way to pay.
But UPI is only part of the story. Digital wallets, cards, IMPS, FASTag, and real-time payments are also changing how people send, receive, and spend money.
This article covers the latest digital payment statistics, usage trends, market shares, fraud figures, and growth forecasts in India and worldwide.
Key Digital Payment Statistics 2026
- UPI processed 24.51 billion transactions in August 2026.
- India’s digital payment volume grew 34.8% in FY2024-25.
- Global real-time payments reached 266.2 billion transactions.
- Digital wallets captured 56% of global online spending.
- UPI accounted for 85% of India’s digital payments.
- India’s Digital Payments Index reached 516.76 in 2025.
Global Digital Payment Growth Statistics
Digital payments are growing across the world, but the pace is different across regions and income groups.
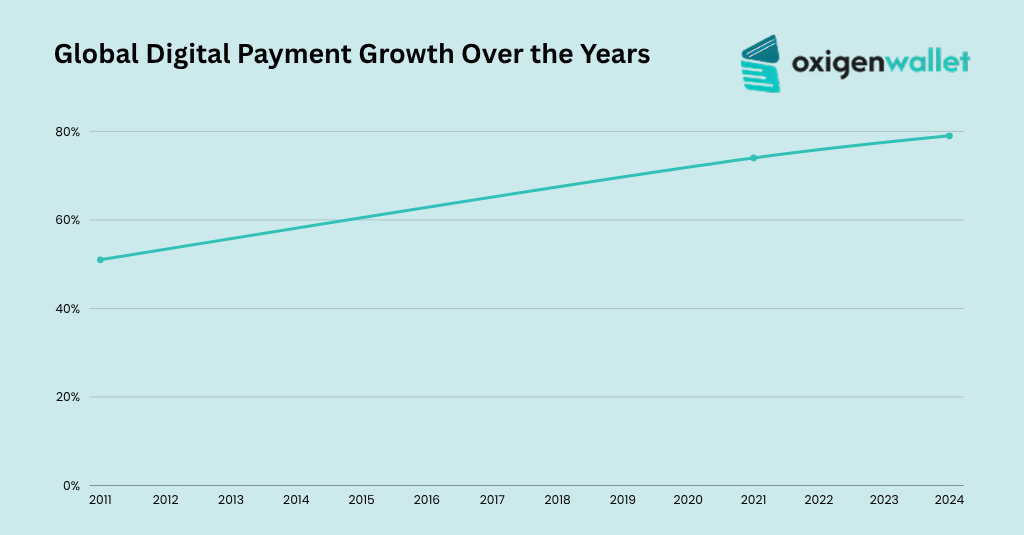
Having a bank or financial account is an important first step toward using digital payments. Account ownership has grown steadily for more than a decade, as shown below.
| Year | Adults with an account |
|---|---|
| 2011 | 51% |
| 2021 | 74% |
| 2024 | 79% |
In developing economies, the share of adults making or receiving digital payments increased from 35% in 2014 to 57% in 2021. By 2024, it had reached 61%.
That’s a 22 percentage point increase in seven years, followed by another 4 points in the next three years. Digital payments use is still growing, but the pace has slowed.
Source: World Bank, World Bank 2, Corporate Visa
Digital Payments and Global Spending
Digital payment methods have taken a much larger share of spending over the past decade.
Their share of global online spending increased from 34% in 2014 to 66% in 2024. In physical stores, it rose from 3% to 38%.
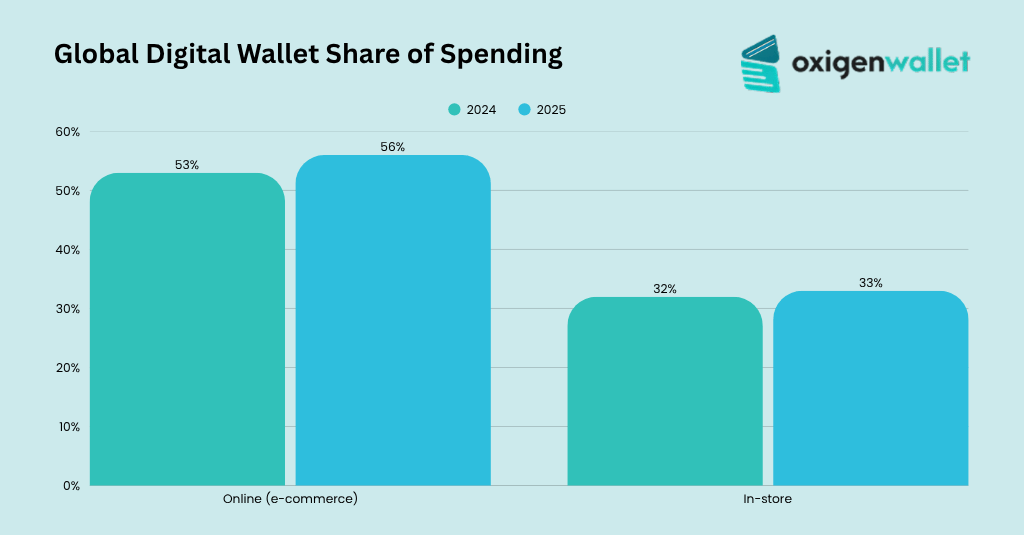
The table below compares the share of global spending made through digital wallets across online and in-store channels in 2024 and 2025.
| Digital wallet share of global spend | 2024 | 2025 |
|---|---|---|
| Online (e-commerce) | 53% | 56% |
| In-store | 32% | 33% |
A higher digital wallet share does not mean cards are disappearing. About 56% of digital wallets worldwide are funded by cards, so many wallet transactions still use card payment networks.
Source: Payments Canada, Worldpay, Global Payments
Global Real-Time Payment Transactions Are Growing Rapidly
Real-time payments let people move money between accounts within seconds. Global real-time payment volume reached 266.2 billion transactions in 2023, up 42.2%.
The volume is expected to reach 575.1 billion by 2028. India is a major part of this growth, driven by rapid use of instant account-to-account payments.
Source: ACI
Digital Payments in India: Statistics and Growth
India’s digital payment growth is closely linked to the rise of UPI. In its first month, August 2016, UPI processed about 90,000 transactions. By August 2026, monthly volume has reached 24.51 billion transactions.
| UPI over a decade | FY2016-17 | FY2025-26 |
|---|---|---|
| Annual transactions | 1.78 crore | 24,162 crore |
| Annual value | ₹0.07 lakh crore | ₹314 lakh crore |
| Banks live on UPI | 44 | 703 |
Key Growth Points
- UPI volume grew 30%, and value grew 21% in FY2025-26.
- Monthly UPI volume crossed 2,300 crore transactions for the first time in May 2026.
- India’s digital payment transaction volume grew 34.8% in FY2024-25, reaching 2,221.9 crore transactions, up from 1,644.3 crore in FY2023-24.
Transaction volume is growing faster than transaction value. This suggests that people are using digital payments more often for small, everyday purchases instead of only making larger payments.
Source: PIB, Business Standard, Outlook, Newsonair, BFSI
RBI Digital Payment Index
The RBI Digital Payments Index shows how widely digital payments are being used across India. It measures progress across five areas, with payment performance carrying the highest weight at 45%.
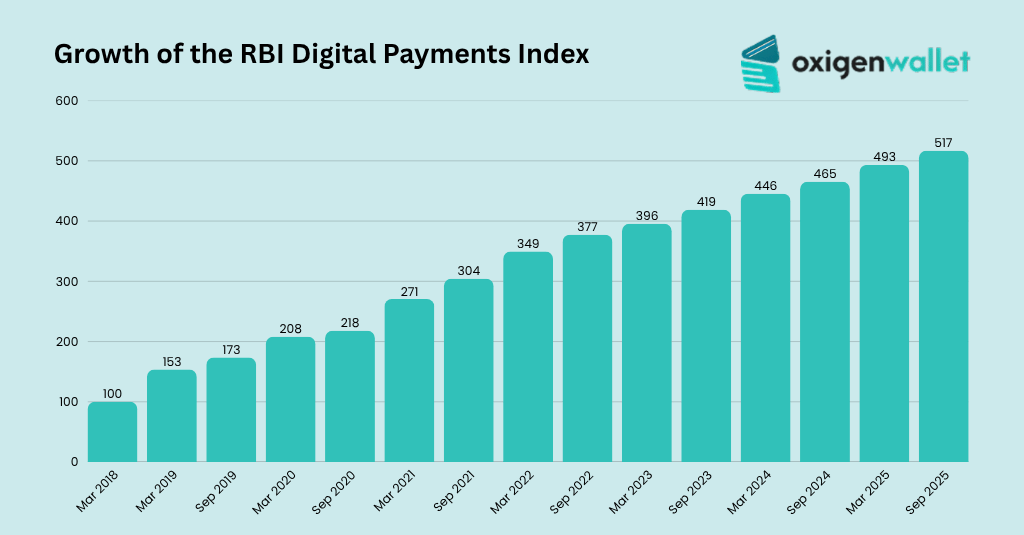
The table below highlights the growth of the RBI Digital Payments Index from March 2018 to September 2025.
| Period | Index score |
|---|---|
| March 2018 | 100 (base) |
| March 2019 | 153.47 |
| September 2019 | 173.49 |
| March 2020 | 207.84 |
| September 2020 | 217.74 |
| March 2021 | 270.59 |
| September 2021 | 304.06 |
| March 2022 | 349.30 |
| September 2022 | 377.46 |
| March 2023 | 395.57 |
| September 2023 | 418.77 |
| March 2024 | 445.50 |
| September 2024 | 465.33 |
| March 2025 | 493.22 |
| September 2025 | 516.76 |
The index has risen from a base score of 100 in March 2018 to 516.76 in September 2025, showing how much India’s digital payment system has expanded over the period.
Source: RBI, Business Standard
How Many People Use Digital Payments?
Digital payments are now common among people who have bank or financial accounts. However, millions of adults still remain outside the formal financial system.
- 79% of adults worldwide have a bank or financial account.
- 82% of account owners in low- and middle-income economies made or received a digital payment in 2024.
- 86% of adults own a mobile phone, including 68% who own a smartphone.
- 1.3 billion adults still do not have an account.
For many people without an account, lack of money is the main barrier to opening one. Better payment apps alone cannot solve this problem.
Source: World Bank, Corporate Visa, World Bank 2, World Bank 3
Digital Payment Usage by Region
Digital payment use varies widely across regions. It reaches about 80% in East Asia and Pacific, compared with 44% in South Asia and the Middle East and North Africa.
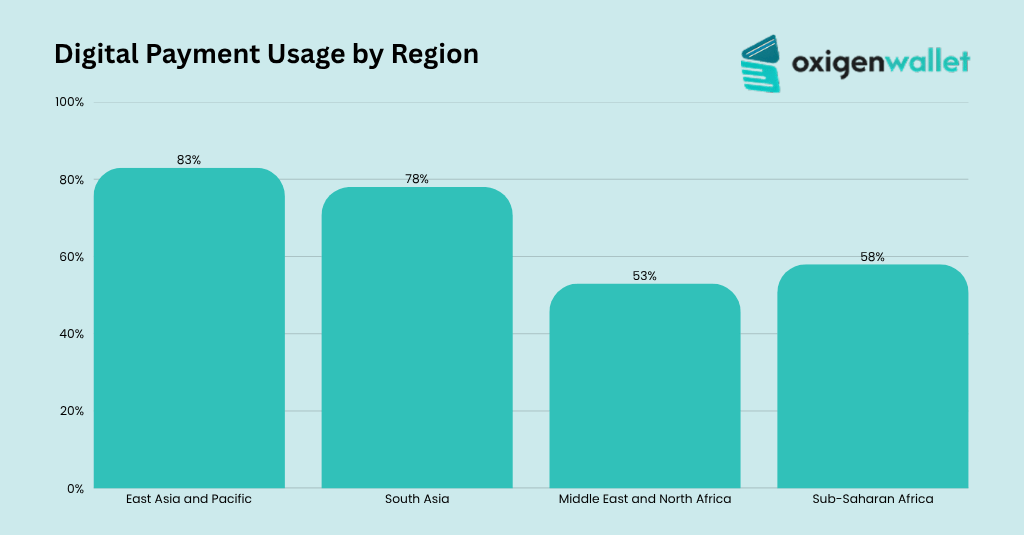
Here is a table showing adult account ownership across different regions.
| Region | Adults with an account |
|---|---|
| East Asia and Pacific | 83% |
| South Asia | 78% |
| Middle East and North Africa | 53% |
| Sub-Saharan Africa | 58% |
South Asia shows a clear gap between account ownership and digital payment use. Only 57% of account holders made or received digital payments, compared with more than 80% in most other regions.
Having an account does not always mean people use it for digital payments.
Source: FinDev Gateway, The Financial Express
Digital Payment Usage Statistics in India
About 91% of Indian adults have an account. The next question is how they use it for everyday payments.
Key Digital Payment Usage Numbers
- UPI averaged 791 million transactions a day in August 2026.
- Merchant payments (P2M) made up 63% of UPI transaction volume.
- Person-to-person transfers (P2P) made up 71% of UPI transaction value.
- Payments below ₹500 accounted for 86% of P2M transaction volume.
- The average UPI payment was about ₹1,217 in August 2026.
A ₹40 cup of chai adds to transaction volume, while a ₹50,000 rent payment adds much more to transaction value. This is why payment volume and payment value can tell different stories.
Source: ET Government, BFSI, PIB, Medianama
Merchant Payment Infrastructure
Merchants are an important part of digital payment growth. QR codes have become a low-cost way for shops and small businesses to accept digital payments.
| Infrastructure | Earlier | May 2026 |
|---|---|---|
| PoS terminals | 45.2 lakh (May 2021) | 115.3 lakh |
| Bharat QR and UPI QR codes | 1,922 lakh (May 2022) | 7,854 lakh |
The rise in PoS terminals and QR codes shows how much India’s payment infrastructure has expanded. More merchants can now accept digital payments, including small shops and businesses.
Source: Market Growth Reports
UPI Statistics: The Engine Behind Digital Payments in India
UPI is at the heart of India’s retail digital payments. Here is the latest monthly snapshot from August 2026.
| August 2026 | Figure |
|---|---|
| Transactions | 24.51 billion, up 22% year on year |
| Value | ₹29.82 lakh crore, up 20% year on year |
| Daily average | 791 million |
| Banks live | 752 |
UPI accounted for 84% of India’s digital payment transactions in FY2025-26. This means that around eight in ten digital payments use UPI.
Source: Outlook, Business Standard, NPCI
UPI Around the World
UPI is the world’s largest real-time payment system by transaction volume. It’s now available in 11 countries as follows:
- United Arab Emirates (UAE)
- France
- Bhutan
- Sri Lanka
- Nepal
- Singapore
- Mauritius
- Qatar
- Cambodia
- Greece
- Maldives
For Indian travellers, this means they can use a familiar payment method in more places. For India, i also expands the reach of its digital payment network.
Foreigners visiting India can also use UPI for merchant payments through UPI One World, a prepaid wallet designed for international visitors. This allows them to make digital payments without needing an Indian bank account.
These cross-border initiatives expand UPI’s reach and help more travelers access India’s digital payment network.
Source: PIB
UPI Transaction Limits
UPI transaction limits decide how much you can send or pay at once. Since September 15, 2025, higher limits have been applied to certain merchant categories.
| Payment type | Limit |
|---|---|
| Person to person (P2P) | ₹1 lakh per day |
| Selected merchant categories such as insurance, capital markets, travel, collections, and GeM | Up to ₹5 lakh per transaction, ₹10 lakh per day |
| Credit card bill payments | Up to ₹5 lakh per transaction, ₹6 lakh per day |
Banks can set lower limits based on their own rules. So, your actual UPI limit may be lower than the limits listed above. For a bank-wise breakdown, see our guide on the maximum UPI transaction limit.
Source: Newsonair
New UPI Rule From October 2026
A new UPI Merchant Discount Rate (MDR) framework will take effect from October 15, 2026. A 0.4% MDR will apply to selected person-to-merchant (P2M) UPI payments above ₹2,000, capped at ₹300 for transactions of ₹75,000 or more.
This does not mean consumers will pay a UPI fee. Person-to-person payments and P2M payments up to ₹2,000 remain free. Payments received by eligible small merchants under the zero-MDR framework will also remain free.
The government says around 96% of P2M UPI transactions will be unaffected. MDR is paid within the payment ecosystem and is not a government or NPCI tax.
Source: Ministry of Finance
Most Popular Digital Payment Methods in India
UPI leads India’s digital payments, but other payment methods still play an important role for different types of transactions and everyday needs.
| Method | Latest data | What it tells you |
|---|---|---|
| UPI | 85% (FY2025-26) | The main choice for everyday payments |
| Credit cards | 124.05 million cards and ₹2.02 trillion spend (August 2026) | Growing with rewards and EMI options |
| Debit cards | Transactions fell from 495.32 crore (2019) to 174 crore (2024) | Now used more for cash withdrawals |
| RuPay cards | ₹63,825.8 crore transactions (Apr-Oct 2024-25) | Strong use at PoS terminals and online |
| IMPS | 360 million transactions (August 2026), down 25% year-on-year | Fewer transfers, but higher average values |
| FASTag | 351 million transactions (August 2026) | Widely used for toll payments |
Credit card ownership continues to grow even when monthly spending moves up or down. Outstanding cards increased from 112.34 million in August 2025 to 124.05 million in August 2026.
Digital wallets are still useful despite UPI’s lead, especially for recurring payments, transit, gaming, and subscriptions. Our explainer on how a digital wallet works covers the basics.
Source: PIB, Business Standard, RBI, Livemint, Medianama, Business Standard 2
Digital Payment Market Share in India
Digital payment market share can look different depending on what you measure. Transaction volume, payment value, and individual app usage can all show different leaders.
Share by Payment Type
UPI leads by transaction volume because it handles many small, everyday payments. RTGS leads by value because it is mainly used for larger money transfers.
| Measure | Leader | Share |
|---|---|---|
| Volume of digital payments | UPI | 85% (FY2025-26) |
| Value of payments | RTGS | 69% |
| Online spending | UPI-led wallets | 68% |
| In-store spending | UPI-led wallets | 61% |
Source: PIB, Upstox, Payment Expert
UPI App Market Share
UPI processed 24.07 billion transactions worth ₹29.37 lakh crore in September 2026. Volume fell 1.8% from August, but daily transactions increased to 802 million.
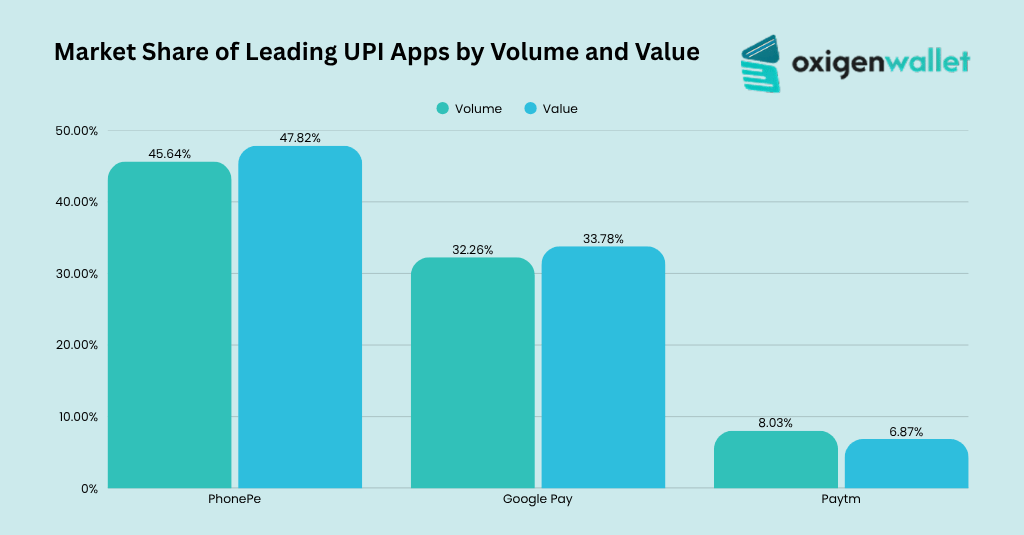
Here is a table showing the market share of leading UPI apps in India by transaction volume and transaction value.
| App | Share of UPI volume | Share of UPI value |
|---|---|---|
| PhonePe | 45.64% | 47.82% |
| Google Pay | 32.26% | 33.78% |
| Paytm | 8.03% | 6.87% |
| Top three apps together | 85.93% | Not available |
Source: Entrackr
Digital Payment Fraud and Safety in India
RBI data shows frauds involving cards, internet banking and digital payments fell to 293 cases worth ₹29 crore in FY2025-26, from 13,332 cases worth ₹517 crore.
These RBI figures cover frauds of ₹1 lakh and above reported by banks. They do not represent every digital payment scam or the total amount customers may have lost.
UPI-specific figures tell a different story. Up to November 2025, UPI-related frauds involved ₹805 crore across 10.64 lakh cases, according to figures cited by the government.
| Year | UPI-related fraud cases | Amount |
|---|---|---|
| FY 2021-22 | n/a | ₹242 crore |
| FY 2022-23 | n/a | ₹573 crore |
| FY 2023-24 | 13.42 lakh | ₹1,087 crore |
| FY 2024-25 | 12.64 lakh | ₹981 crore |
| FY 2025-26 (to Nov) | 10.64 lakh | ₹805 crore |
The RBI also warns that the amount involved in reported bank frauds does not always equal the final loss. Recoveries and other factors can change the actual amount lost.
Source: The Hans India
Digital Payment Market Size and Forecasts for India
UPI is expected to reach 1 billion transactions per day by FY28. It averaged 791 million daily transactions in August 2026, putting it about 209 million transactions short of that target.
| Measure | Current | Forecast |
|---|---|---|
| Digital payment volume | 206 billion (FY25) | 617 billion (FY30) |
| Digital payment value | ₹299 trillion (FY25) | ₹907 trillion (FY30) |
| Retail digital payments | ₹300.6 trillion (FY24) | ₹584.5 trillion (2030) |
Global Digital Payment Forecasts
Digital payments are expected to take a larger share of spending worldwide. Payment apps could account for 46% of global in-store payment value by 2030, worth about $15.6 trillion.
Buy now, pay later is also expected to grow. Its share of global e-commerce payment value could reach $500 billion by 2030.
Source: Global Payments
How India Compares With the World
India stands out for the scale of UPI and wallet payments. However, cards remain the main payment method in several other major markets.
| Indicator | India | World or other markets |
|---|---|---|
| Share of real-time payments (2023) | 49% | Brazil 14%, Thailand 8%, China 7% |
| Wallet share, online (2025) | 68% | 56% global, 40% US |
| Wallet share, in-store (2025) | 61% | 33% global, 17% US |
| Adults with an account | About 89% | 79% global |
Source: ACI, Payment Expert, World Bank, World Bank 2
What’s Next for Digital Payments in India
India’s digital payment system is still changing. Several new rules, features, and payment technologies could shape how people and businesses make digital payments.
- Market share cap: NPCI’s 30% limit for any single UPI app is due to take effect on January 1, 2027, following the current December 31, 2026 deadline.
- Safety tools: RBI has proposed a kill switch that could let customers quickly block outgoing digital payments if fraud is suspected.
- Easier bank switching: A proposed payment switching service could make it easier to move linked payment mandates when customers change banks.
- Cross-border payments: UPI is already available in 11 countries, while RBI is also working on international payment projects.
- New UPI features: UPI Circle allows delegated payments, while UPI Reserve Pay is designed for payments using a pre-approved amount.
- AI in payments: Banks are using AI to detect suspicious transactions faster, while newer payment systems are exploring AI-based transactions.
- Merchant fees: Changes to UPI’s MDR structure could create new revenue opportunities for payment apps while keeping many smaller transactions free.
Source: DD News, RBI, Reuters, RBI 2, Mastercard, Ministry of Finance