

PhonePe, Google Pay, and Paytm lead India’s UPI market. PhonePe handles over 10,330 million transactions (46.26%), Google Pay 7,359 million (32.75%), and Paytm 1,778 million (7.91%), highlighting their dominant role in India’s digital payments.
Together, they showcase rapid adoption, growing competition, and the evolving dynamics of India’s UPI ecosystem.
In this article, we will explore these top apps individually and examine emerging players like Navi, super.money, and CRED, which are innovating in niche segments.
UPI Market Share Overview: Top Picks (2026)
- PhonePe leads the UPI market value with 46.26%, followed by Google Pay with 32.75% and Paytm with 7.91%.
- Apps like Navi, super.money, CRED, BHIM, and Amazon Pay are controlling a combined 13.08% market share.
- NPCI’s 30% volume cap per app aims to prevent market over-concentration and foster competition.
- UPI transactions increased from 1,207 million in FY18 to 97,295 million in FY24, indicating fast adoption.
- In June 2026, UPI transaction value decreased by -2.09% MoM to ₹28.92 lakh crore, driven by surges during festivals and by merchants.
- UPI is expected to maintain more than 80% of digital payment volume, while international expansion may affect market shares.
Top UPI Apps In India by Market Share
PhonePe leads the UPI market, followed by Google Pay and Paytm. Let’s take a closer look at the top apps by transaction volume and value, as well as emerging players.
The following data shows the market share of the leading UPI apps as of July 2026.
By Transaction Volume & Value
Let us look at the top UPI apps contributing to the UPI market share by transaction volume and value
1. PhonePe
PhonePe currently accounts for 49.06% of overall UPI volume, with over 10,330 million transactions completed. In terms of transaction value, it commands approximately 46.26% of the market, with a staggering ₹13 lakh crore.
PhonePe stands out for its widespread merchant adoption, making it a popular alternative for anything from supermarket payments to bill settlements.
2. Google Pay
Google Pay follows closely with 7,359 million transactions, accounting for 33.54% of overall UPI usage. It handles ₹9.5 lakh crore in transactions, accounting for 32.75% of the overall UPI value.
GPay has used its simplicity and connectivity with Gmail and Android devices to provide a seamless experience for millions of consumers.
3. Paytm
While Paytm’s transaction volume (1,778 million) accounts for only 6.66% of total UPI volume, its influence in the ecosystem remains significant. The transaction value is ₹1.67 lakh crore, accounting for around 7.91% of the whole market.
Paytm continues to prioritize its loyal user base and new services such as Paytm Wallet and QR payments in tier 2 and tier 3 locations.
Emerging & Niche UPI Apps
While PhonePe, Google Pay, and Paytm dominate UPI, smaller emerging apps are innovating in unique ways, slowly creating their own space in digital payments.
The emerging UPI apps are as follows:
1. Navi UPI
Navi UPI recorded 709 million transactions, accounting for 3.2% of total UPI traffic. Its expansion is dependent on adding financing alternatives directly into the app.
Navi encourages consumers to stay engaged by providing credit solutions alongside payment options, transforming regular transactions into opportunities to manage their finances.
2. super.money
super.money utilizes the Flipkart ecosystem, with 298 million transactions and a 1.3% volume share.

Users receive cashback and points for purchases and bill payments, resulting in a loop in which the app’s utility grows alongside its shopping platform.
3. CRED
CRED concentrates on high-value, credit-savvy users, executing 157 million transactions, or approximately 0.8% of UPI activity.
Its advantage comes from rewarding premium customers with exclusive incentives, transforming basic credit card and bill payments into a loyalty-driven experience.
4. BHIM
With 172 million transactions and a 0.7% market share, BHIM remains a vital link between urban and rural India.
Government backing provides trust, while the simplicity appeals to first-time UPI consumers. BHIM shows how policy and inclusion initiatives may coexist with market competitiveness.
5. Amazon Pay
Amazon Pay recorded 94 million transactions, which account for around 0.5% of total UPI traffic.
Amazon Pay ensures that users not only pay, but also spend efficiently within a familiar platform by providing a seamless interface between payments and online purchases.
Source: Entrackr
Regulatory Impact On UPI App Market Share
UPI is formed not only by user preferences or app features, but also by regulations.
Take a look at the Regulatory Impact on UPI App Market Share:
NPCI’s Market Share Cap
At present, PhonePe (45.5%) and Google Pay (34.6%) together control over 83% of UPI volume, far above the prescribed threshold.
To tackle this, NPCI introduced a 30% volume cap per UPI app to prevent over-concentration.
Source: Livemint, Fortune India
Zero MDR Policy
UPI transactions increased from 1,207 million in FY18 to more than 97,000 million in FY24, mostly due to a zero MDR regime.
Regulation increased adoption among small enterprises and kirana outlets by reducing merchant expenses.
Source: NPCI
Bank Participation
The number of UPI-enabled banks expanded from 44 in FY17 to over 570 by FY24, and then to 685 in FY25 (as of December 2025).
This regulatory drive increased access across the country, bringing in additional users and transactions without favoring any one app.
Source: NPCI
Growth Trends Of UPI Apps Tied To Market Share
Let us look at the different trends in market share over time:
YoY Trends
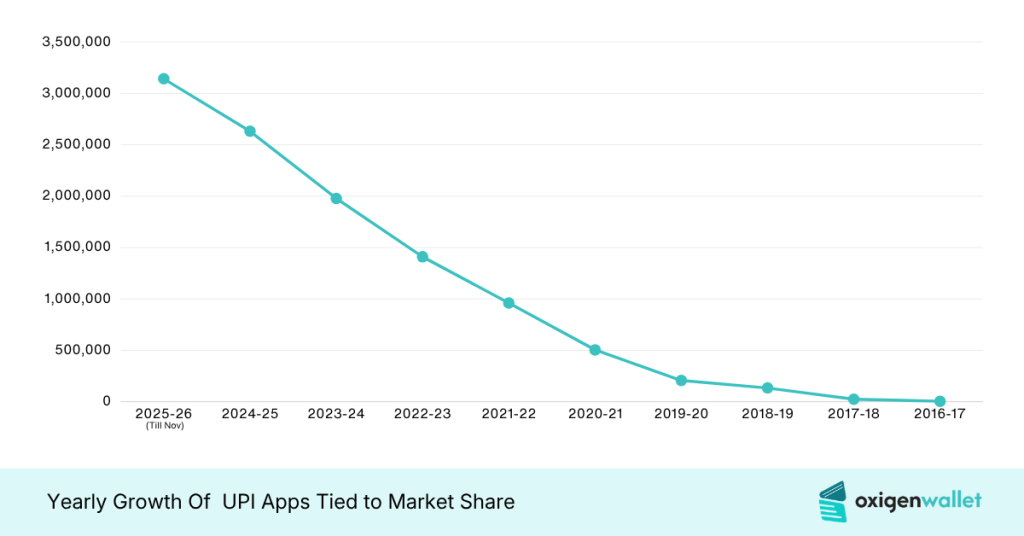
The table below summarizes YoY trends:
| FY | Banks Live | Total Volume (Mn) | YoY % Volume | Total Value (₹ Cr) | YoY % Value |
|---|---|---|---|---|---|
| 2025-26 | 703 | 2,41,620 | +30.0% | 31,42,300.00 | +20.6% |
| 2024-25 | 684 | 1,85,870 | +29.4% | 26,31,632.61 | +33% |
| 2023-24 | 572 | 97,294.92 | +63% | 19,78,353.23 | +40.3% |
| 2022-23 | 399 | 69,613.66 | +98.7% | 14,10,443.01 | +46.8% |
| 2021-22 | 314 | 35,042.99 | +57.7% | 9,60,581.66 | +90% |
| 2020-21 | 216 | 22,213.34 | +91% | 5,04,886.44 | +144.5% |
| 2019-20 | 148 | 11,607.34 | +70% | 2,06,462.31 | +54.7% |
| 2018-19 | 142 | 6,830.03 | +465% | 1,33,460.72 | +452% |
| 2017-18 | 91 | 1,207.46 | +10,334% | 24,172.60 | +449% |
| 2016-17 | 44 | 11.68 | – | 4,399.53 | – |
UPI evolved from a pilot project into a mainstream payment system as both banks and users rapidly adopted it.
With merchants increasingly embracing the platform and the introduction of new features, transactions expanded beyond peer-to-peer payments, driving steady, scale-driven growth across the digital payments ecosystem.
MoM Trends
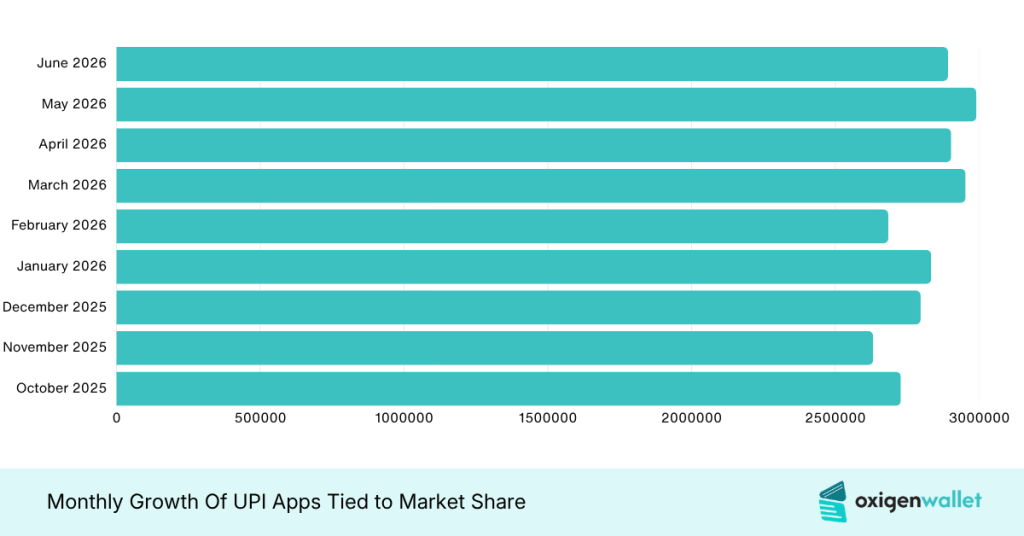
In the table below, we can track monthly patterns:
| Month (2025-26) | Banks Live | Volume (Mn) | MoM % Volume | Value (₹ Cr) | MoM % Value |
|---|---|---|---|---|---|
| October 2025 | 683 | 20,700.92 | +5.44% | 27,27,790.68 | +9.56% |
| November 2025 | 684 | 20,466.98 | -1.13% | 26,31,632.63 | -3.52% |
| December 2025 | 685 | 21,634.67 | +5.71% | 27,96,712.73 | +6.27% |
| January 2026 | 691 | 21,703.44 | +0.32% | 28,33,481.22 | +1.31% |
| February 2026 | 694 | 20,394.18 | -6.03% | 26,84,229.29 | -5.27% |
| March 2026 | 703 | 22,640.00 | +11.01% | 29,53,000.00 | +10.01% |
| April 2026 | 713 | 22,346.80 | -1.30% | 29,02,988.05 | -1.69% |
| May 2026 | 720 | 23,201.93 | +3.83% | 29,90,424.21 | +3.01% |
| June 2026 | 731 | 22,716.07 | -2.09% | 28,92,138.67 | -3.29% |
Source: NPCI
Throughout 2025-26, UPI activity remained steady, supported by consistent engagement from both users and banks.
While shifting spending patterns caused monthly peaks and minor declines, reflecting timing variations, growth was actively fueled by merchants and festive transactions, sustaining scale-driven usage throughout the year.
UPI Apps Future Projections For Market Shares
India’s UPI apps market is expected to grow steadily through 2030, driven by supportive government policies and rising smartphone and internet adoption.
The UPI apps market is expected to grow at a CAGR of around 10.5% between 2024 and 2030, reflecting widespread adoption.
Increasing consumer preference for digital payments is fueling demand, with both urban and rural areas contributing to the ecosystem’s expansion.
Source: MarkNtel Advisors
Related Reads:
Conclusion: PhonePe Leads The UPI Market With 46.26% Market Share
PhonePe maintains its lead, with UPI transactions reaching 1,25,945 million in FY25-26, up 29.4% YoY, and a total value of ₹26.3 lakh crore.
Over 685 banks now support UPI, fueling adoption and merchant growth. Emerging competitors like Navi and regulations like Zero MDR actively encourage innovation, driving healthy competition.
This dynamic environment ensures the UPI ecosystem expands steadily, with more users, diverse services, and increasing value flowing through digital payments across the country.
FAQs
PhonePe leads with 10,330 million transactions, controlling 46.26% of the market, followed by Google Pay and Paytm.
Navi, super.money, and CRED focus on financing, rewards, and premium user engagement, gradually expanding their share in UPI transactions.
NPCI enforces a 30% volume cap per app to prevent dominance and encourage competition among UPI platforms.
Transactions rose from 1,207 million in FY18 to 97,295 million in FY24, showing rapid nationwide adoption across banks.
With 83.7% digital payment volume in FY25, UPI will maintain dominance while international expansion and regulations influence competition.